
Temperature [C] Anomaly Plots of Various Depths based on the difference between WOA13 and different Models
Image
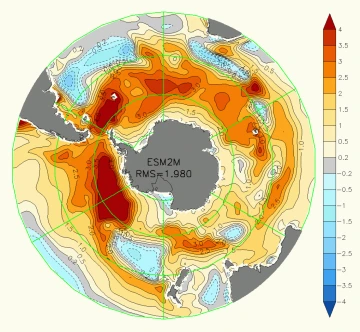
An anomaly plot at surface level based on the ESM2M Model
Image
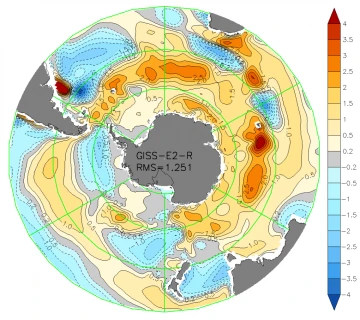
GISS-E2-R Model anomaly plot created at a depth of 50 Meters
Image
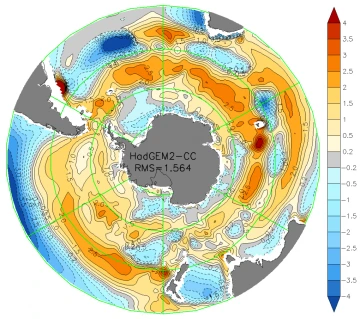
HadGEM2-CC Model anomaly plot created at a depth of 200 Meters
Image
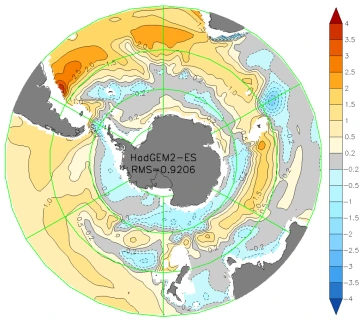
HadGEM2-ES Model anomaly plot created at a depth of 800 Meters
Image
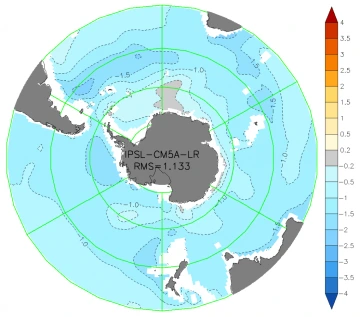
IPSL-CM5A-LR Model anomaly plot created at a depth of 1500 Meters
Image
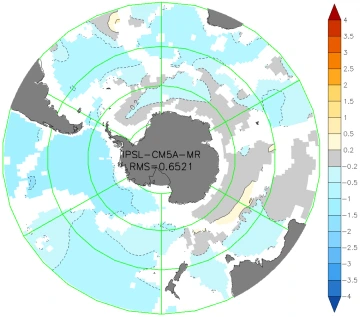
IPSL-CM5A-MR Model anomaly plot created at a depth of 3500 Meters