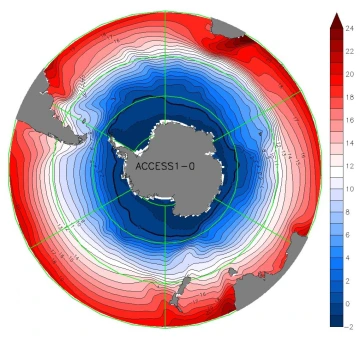
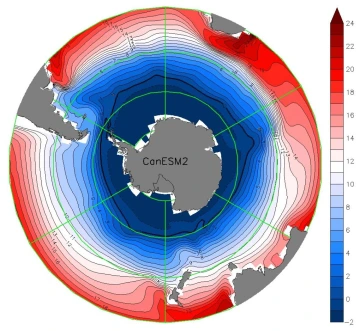
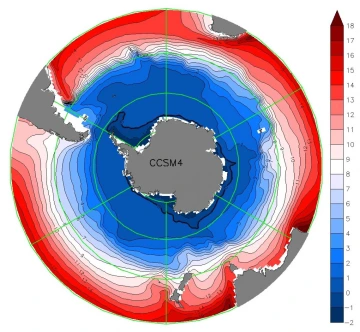
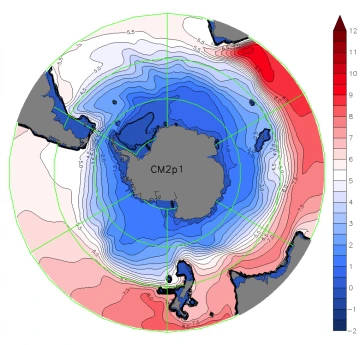
Temperature [C] Polar Plots of Various Depths based on different Models
Image
![temp_z=0_ACCESS1-0_0](/sites/default/files/styles/az_small/public/2022-08/temp_z%3D0_ACCESS1-0_0_1.jpeg.webp?itok=7gVvUA84)
A polar plot at surface level based on ACCESS1-0 Model data
Image
![temp_z=50_CanESM2_0](/sites/default/files/styles/az_small/public/2022-08/temp_z%3D50_CanESM2_0_1.jpeg.webp?itok=UdfBSfSq)
CanESM2 Model plot created at a depth of 50 Meters
Image
![temp_z=200_CCSM4_0](/sites/default/files/styles/az_small/public/2022-08/temp_z%3D200_CCSM4_0_0.jpeg.webp?itok=3e91liSI)
CCSM4 Model plot created at a depth of 200 Meters
Image
![z800_temp_cm2p1](/sites/default/files/styles/az_small/public/2022-08/z800_temp_cm2p1_0.png.webp?itok=zSxDL6oN)
CM2p1 Model plot created at a depth of 800 Meters
Image
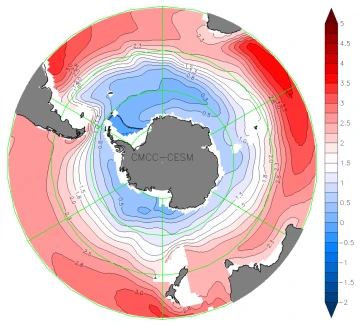
![temp_z1500_cmcc_0](/sites/default/files/styles/az_small/public/2022-08/temp_z1500_cmcc_0_0.png.webp?itok=Kwy73ZV5)
CMCC-CESM Model plot created at a depth of 1500 Meters
Image
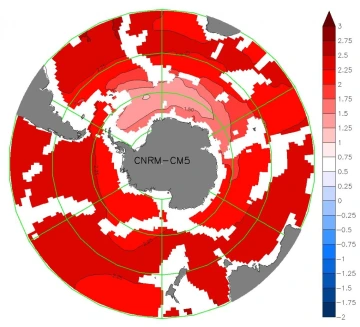
![temp_z=3500_CNRM-CM5_0](/sites/default/files/styles/az_small/public/2022-08/temp_z%3D3500_CNRM-CM5_0_0.jpeg.webp?itok=7zBD7gMk)
CNRM-CM5 Model plot created at a depth of 3500 Meters