
Temperature [C] Latitudinal and Anomaly Plots at Various Latitudes of different Models
Image
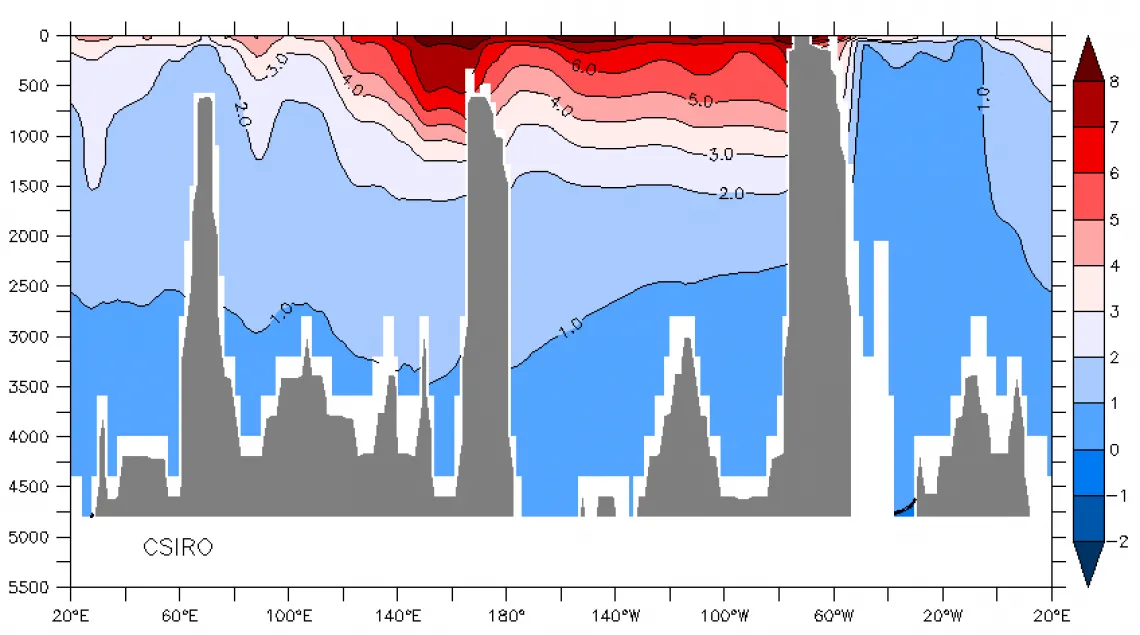
Temperature [C] Latitudinal Plot based on the CSIRO Model at a latitude of 50S
Image
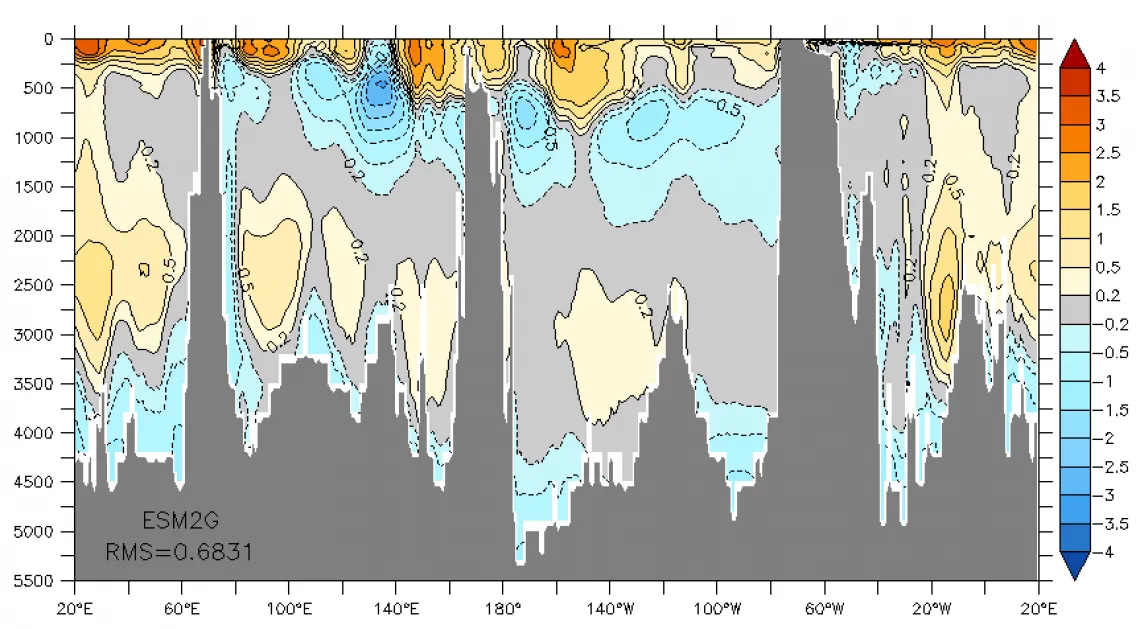
Temperature [C] Latitudinal Anomaly Plot based on the difference between WOA13 and the ESM2G Models at 50S
Temperature [C] Latitudinal and Anomaly Plots at Various Latitudes of different Models
Image
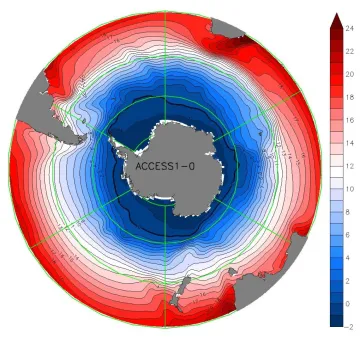
A polar plot at surface level based on ACCESS1-0 Model data
Image
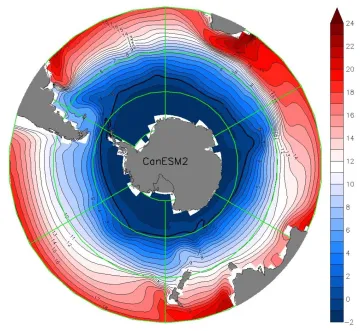
CanESM2 Model plot created at a depth of 50 Meters
Image
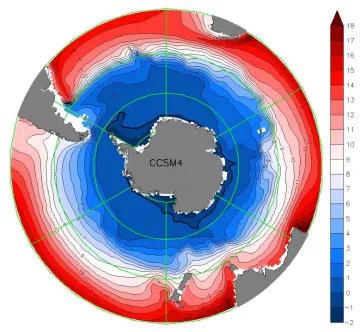
CCSM4 Model plot created at a depth of 200 Meters
Image
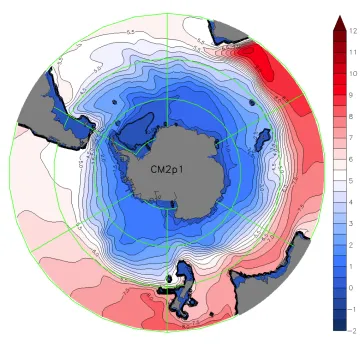
CM2p1 Model plot created at a depth of 800 Meters
Image
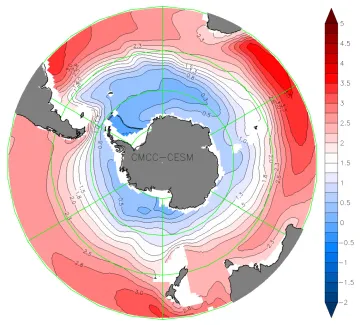
CMCC-CESM Model plot created at a depth of 1500 Meters
Image
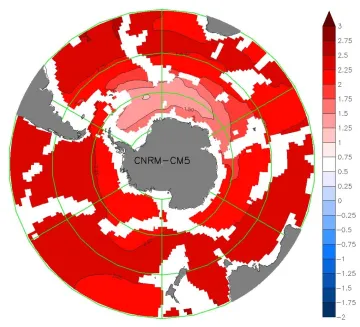
CNRM-CM5 Model plot created at a depth of 3500 Meters