
Example Plots
Polar Temperature Latitude vs Longitude (Surface)
Image
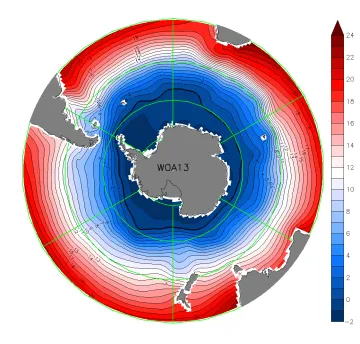
Looking at Temperature (Kelvin) from Southpole at the surface of the Water.
Salinity Latitude vs Depth (150°W)
Image
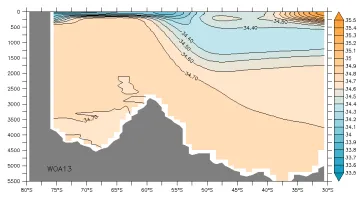
Looking at Salinity from a Latitudinal slice at 150° West.
Dissolved Inorganic Carbon Anomaly NorESM Longitude vs Depth (60°S)
Image
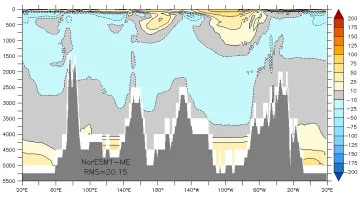
Looking at an Anomaly [woa13 - NorESM1-ME] of Dissolved Inorganic Carbon (mol m-3) from a Longitudinal slice at 60° South.