
Temperature [C] Polar and Anomaly Plots at Various Depths of different Models
Image
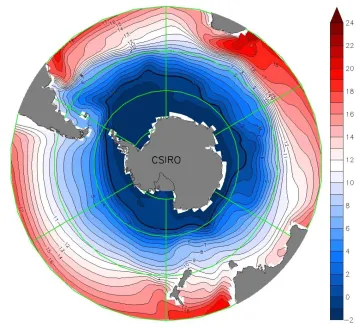
A temperature [C] polar plot based on the CSIRO Model at a depth of 200 Meters
Image
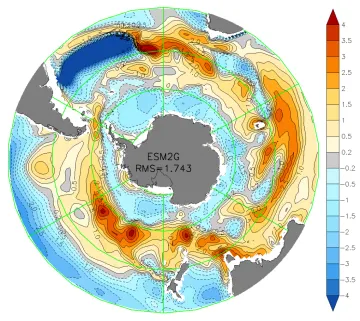
A temperature [C] anomaly plot based on the difference between the WOA13 and the ESM2G Models at a depth of 200 Meters