
Dissolved Inorganic Carbon Plots and Anomalies of different Latitudinal, Longitudinal, and Polar Cross Sections based on different Models
Image
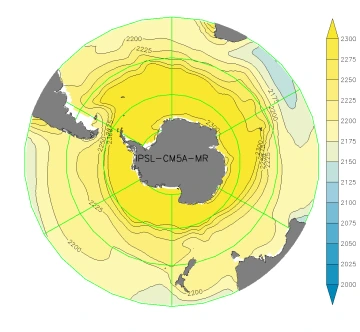
IPSL-CM5A-MR Model Polar Plot created at a depth of 200 Meters |
Image

MIROC-ESM Model Polar Anomaly Plot created at a depth of 200 Meters |
Image
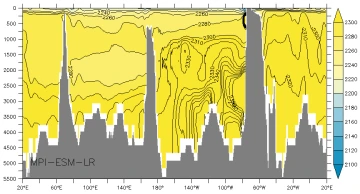
MPI-ESM-LR Model Latitudinal Plot created at a latitude of 50S |
Image
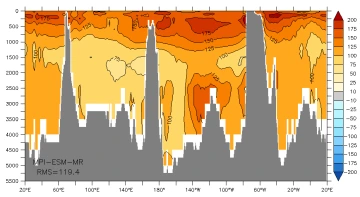
MPI-ESM-MR Model Latitudinal Anomaly Plot created at a latitude of 50S |
Image
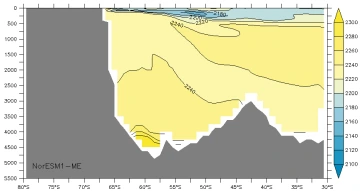
NorESM1-ME Model Longitudinal Plot created at a longitude of 90E |
Image
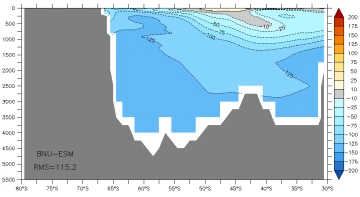
BNU-ESM Model Longitudinal Anomaly Plot created at a longitude of 90E |