Temperature [C] Plots and Anomalies of different Latitudinal, Longitudinal, and Polar Cross Sections based on different Models
Image
![.](/sites/default/files/styles/az_small/public/2022-08/z200_temp_miroc5_1.png.webp?itok=j0yNiXLT)
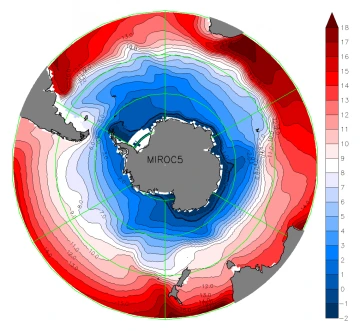
MIROC5 Model Polar plot at a depth of 200 Meters
Image
![temp_z200_miroc_anomaly_0](/sites/default/files/styles/az_small/public/2022-08/temp_z200_miroc_anomaly_0.png.webp?itok=F7PRJKUY)
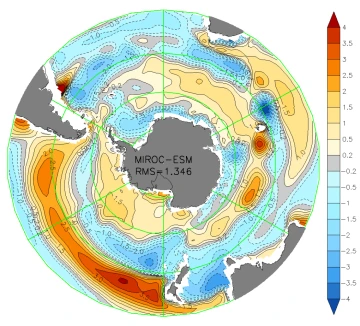
MIROC-ESM Model Polar anomaly plot at a depth of 200 Meters
Image
![50s_temp_mpi_0](/sites/default/files/styles/az_small/public/2022-08/50s_temp_mpi_0.png.webp?itok=m5VdWsaQ)
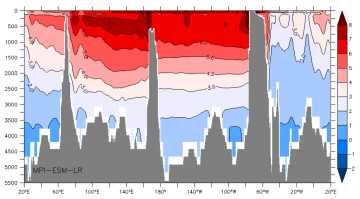
MPI-ESM-LR Model Latitudinal plot at a longitude of 50S
Image
![50s_temp_mpi_0](/sites/default/files/styles/az_small/public/2022-08/50s_temp_mpi-esm-mr_anomaly_0.png.webp?itok=dSIR6mdN)
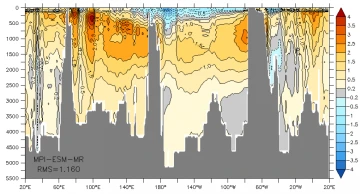
MPI-ESM-MR Latitudinal anomaly plot at a latitude of 50S
Image
![90e_temp_mpi-esm-p_0](/sites/default/files/styles/az_small/public/2022-08/90e_temp_mpi-esm-p_0.png.webp?itok=biPaA11q)
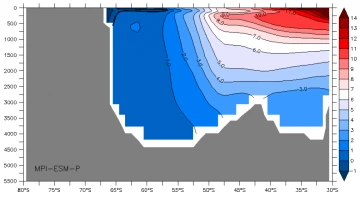
MPI-ESM-P Model Longitudinal plot at a longitude of 90E
Image
![90e_temp_mri-cgcm3_anomaly_0](/sites/default/files/styles/az_small/public/2022-08/90e_temp_mri-cgcm3_anomaly_0.png.webp?itok=isNBnZl0)
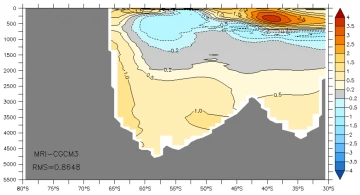
MRI-CGCM3 Model Longitudinal anomaly plot at a longitude of 90E