
Temperature [C] Latitudinal Plots at Various Latitudes based on different Models
Image
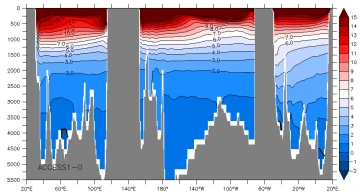
A Latitudinal plot at 30S based on the ACCESS1-0 Model |
Image
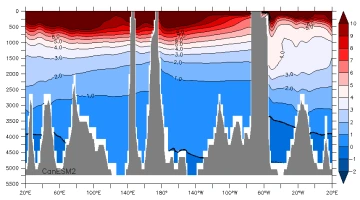
CanESM2 Model plot created at a latitude of 40S |
Image
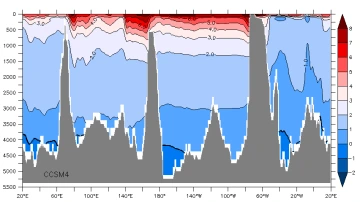
CCSM4 Model plot created at a latitude of 50S |
Image
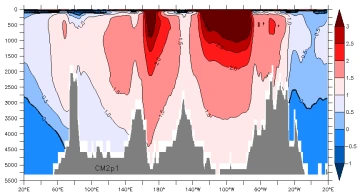
CM2p1 Model plot created at a latitude of 60S |
Image
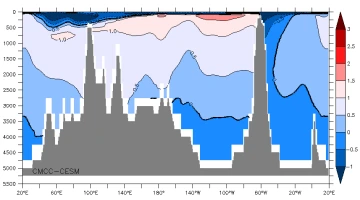
CMCC-CESM Model plot created at a latitude of 65S |
Image
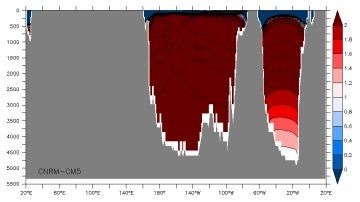
CNRM-CM5 Model plot created at a latitude of 70S |