
Temperature [C] Longitude and Longitude Anomaly Plots at Various Longitudes of different Models
Image
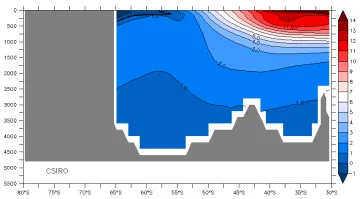
Temperature [C] Longitudinal Plot based on the model CSIRO at a longitude of 90E |
Image
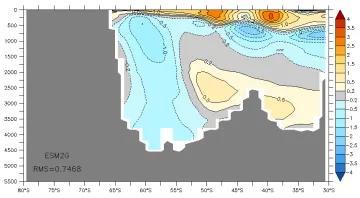
Temperature [C] Longitudinal Anomaly Plot based on the difference between WOA13 and the ESM2G Model at 90E |