
Salinity Longitudinal Plots of Various Longitudes based on different Models
Image
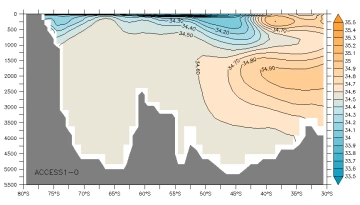
ACCESS1-0 Model plot created at a longitude of 30W |
Image
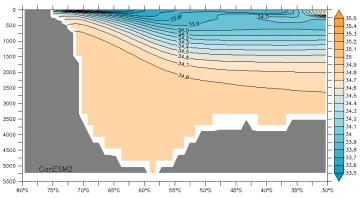
CanESM2 Model plot created at a longitude of 105W |
Image
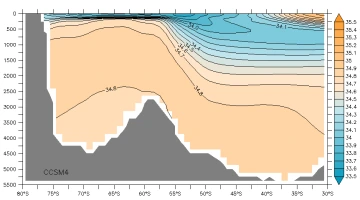
CCSM4 Model plot created at a longitude of 150W |
Image
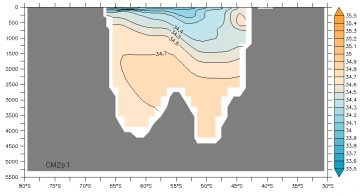
CM2p1 Model plot created at a longitude of 145E |
Image
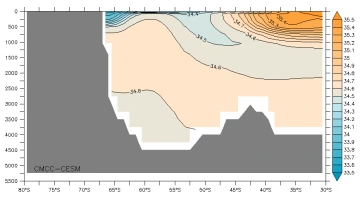
CMCC-CESM Model plot created at a longitude of 90E |
Image
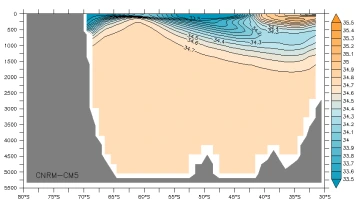
CNRM-CM5 Model plot created at a longitude of 30E |