
Salinity Latitude Plots and Latitudinal Anomaly Plots at Various Latitudes based on different Models
Image
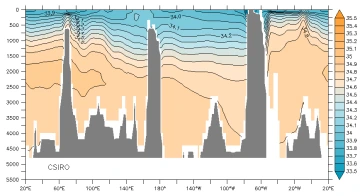
Salinity Latitudinal Plot based on the CSIRO Model at a latitude of 50S |
Image
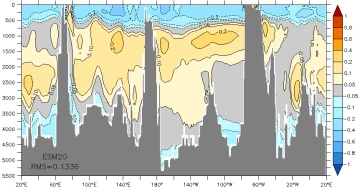
Salinity Latitudinal Anomaly Plot based on the difference between the WOA13 and ESM2G Models at a latitude of 50S |