
Salinity Latitudinal Anomaly Plots of Various Latitudes based on the difference between WOA13 and different Models
Image
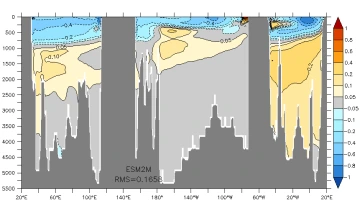
ESM2M Model anomaly plot at a latitude of 30S |
Image
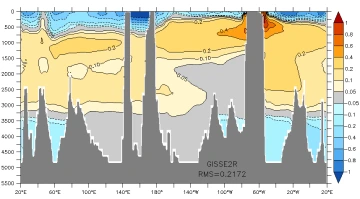
GISS-E2-R Model anomaly plot at a latitude of 40S |
Image
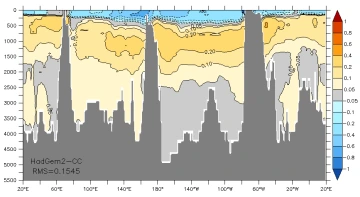
HadGem2-CC Model anomaly plot at a latitude of 50S |
Image
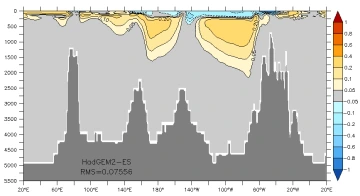
HadGEM2-ES Model anomaly plot at a latitude of 60S |
Image
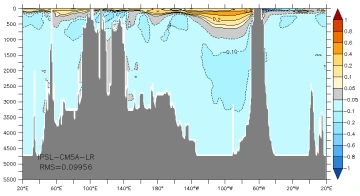
IPSL-CM5A-LR Model anomaly plot at a latitude of 65S |
Image
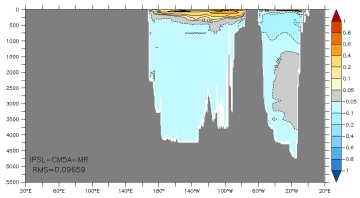
IPSL-CM5A-MR Model anomaly plot at a latitude of 70S |