
Salinity Longitudinal Anomaly Plots at Various Longitudes based on the difference between WOA13 and different Models
|
Image
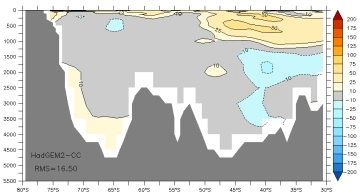
HadGEM2-CC Model Longitudinal Anomaly Plot created at a longitude of 30W |
Image
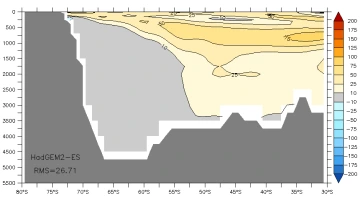
HadGEM2-ES Model Longitudinal Anomaly Plot created at a longitude of 105W |
Image
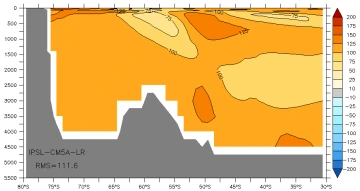
IPSL-CM5A-LR Model Longitudinal Anomaly Plot created at a longitude of 150W |
|
Image
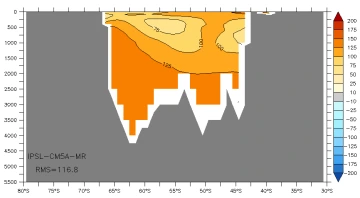
IPSL-CM5A-MR Model Longitudinal Anomaly Plot created at a longitude of 145E |
Image
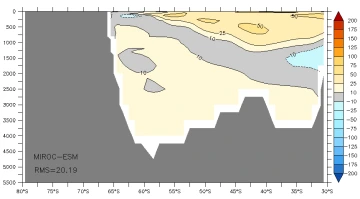
MIROC-ESM Model Longitudinal Anomaly Plot created at a longitude of 90E |
Image
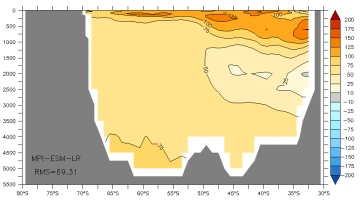
MPI-ESM-LR Model Longitudinal Anomaly Plot created at a longitude of 30E |